User Guide – Teamoty Scheduling
5. USING THE SCHEDULE
Now that all the adjustments have been made and the sequences established, you can go to the PLANNING tab in PROJECT to represent your schedule.
5.1. Objectives
- Mastering the different filters, groupings and format of the planning
- Be able to make the necessary changes to your schedule
- Change the style of your schedule and export it
5.2. Ergonomic
- First, to have a better visualization of a schedule, click on the button
 in Screen to switch to full screen mode.
 - Two knobs to zoom in and out the schedule display with the X-axis impact on time and Y-axis impact on zoning:

- You can also add several filters to generate a display of the specific schedule especially over a period; do not forget to click on the Reload button to the right of the period:

- It is possible to filter the display of a whole level of planning zoning by clicking on the funnel in the column header:
 . You
. You - You can also group a whole zoning level or only an area (a building, a floor, a facade), there is an button
 next to each zone name.
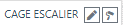
 - When the mouse hovers over an area, there is a button that appears:
 to edit an area: name, type of area, plane, etc.
 - Above the schedule, we find two pieces of information:
- Colored bars, defining current sequences,
- The number of employees per day according to the different tasks for the entire schedule

- You can enlarge or shrink these two pieces of information, if you want to show them more or delete them. To do this, hold down the sequence bar or the one for the population curve, shown in red below the example, to modify the sequences:

- By hovering over a task, you find predecessors and successors with the link type (Finish to Start for example). The links in black are the links of the same sequence, the links in orange are the links with other sequences, as below:

![]() When you are in the Edit, Modify, Point modes, you no longer have access to the pop-up when hovering over a task. You can find this pop-up by holding down the SHIFT key while hovering over the task.
When you are in the Edit, Modify, Point modes, you no longer have access to the pop-up when hovering over a task. You can find this pop-up by holding down the SHIFT key while hovering over the task.
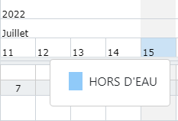
- If a key date is added to the schedule, you will see it on the selected date and color. If you position your mouse on the date, a pop-up will open to display the name of the key date:
5.2.1. Indicators for monitoring implementation
- On the schedule, you will find a line in grey at the top of your schedule with a figure for each day of your schedule. This is an indicator giving you the number of zones per day where there is activity on your project:

You can remove this information by going to Filters and then unchecking “hidden statistical line”.
- If you use constraining resources in your planning (see below Constraint planning: type of resource, ), an indicator will be added indicating the number of resources entering the “Use” phase and that day by day. This indicator will allow you to track the capabilities of your resources and know when they are being used:

- If you have added the tracking indicator for specific tasks (see Types of tasks), a new line will appear on your schedule. This allows you to calculate the number of running tasks per day. To do this, simply check the button
 in the task edition. You will get a line as below:

5.2.2. Contrainte planning : type de ressource
- If you have defined schedule constraints with a resource type with associated resources, you will find this information in the global planning at the zoning level with the type of resource used in parenthesis and a specific column for the resources in use. The schedule will take into account the resource constraints defined for the execution of the tasks, as below, where Façade 3 cannot begin until Façade 1 has released the resource «scaffolding 1». For exemple :

5.2.3. Modification of the scheduling of zones from the schedule
- From the schedule, you can perform the following actions in use the action buttons at the bottom left of the zoning, in the Planning tab:
 : Allows you to change the zone ordering. Once the mode is selected, just hold the left click on an area and drag & drop vertically
 : allows you to swap the execution order of two areas from the schedule without changing the graphic order. This allows you to modify the zones without editing all the sequences of these zones. Clicking on it will open a new window to select the two areas to swap.
 : Directly access the Zones screen of your project.
5.2.4. Edition & Modification
From the schedule, you can move or change the duration of a task, several modes are possible:
 : which allows to add a free task, which will have no predecessor or successor and will be represented on the schedule as a classic task:
 : which allows you to edit a task in a sequence, click on any task (this is the shortcut to Edit Tasks).
 : allows you to edit a micro-task (a task on a specific area) in order to modify its duration, effective and modify the progress for example.
 : allows you to change the date as soon as possible. This mode moves your task from the originally calculated start date while keeping the predecessors/successors links. This type of modification is represented on the schedule with a black border on the left and at the bottom of the task:
 : which allows free editing with link. This mode allows to move the task without constraint while keeping the links, so you could move this task before its predecessor. This type of modification is represented on the schedule with a left and right border:
 : which allows free modification. This mode allows you to move the task without impacting related tasks. It will no longer be related to other tasks. This type of modification is represented on the schedule with a black border on the left, right and bottom:
 : Clear the change(s) made to the task.
- To change the duration of a task, you can do so from the micro-task, from the Micro-task tab in the editing of a task (see Tasks) or by selecting the first type of change and then dragging the mouse to increase the duration of the task. The task will be materialized with a black border below the task:
 .
.
![]() Shortcut: By selecting one of the two Edit modes, you can switch between them by holding down the CTRL key.
Shortcut: By selecting one of the two Edit modes, you can switch between them by holding down the CTRL key.
5.2.5. Editing micro-tasks
In the Edit menu, you can modify a micro-task: ![]() . To do this, simply select and click directly on any micro-task.
. To do this, simply select and click directly on any micro-task.
- Detail tab: Change the date as soon as possible, the duration or the number of the micro-task. You can also add speakers on this micro-task (see Stakeholders below).

- Progress tab: Have the score history of a micro-task with the date and percentage of progress. You can also change old scores. For each score, speakers can be added (see Stakeholders below). For each score you will find the information of “who performed the point action”. Example here: Christophe RICOU pointed out the task, and the name of the speaker is TOTO.

- Blocking points tab: Have the list of blocking points, edit them and be able to add new ones on a micro-task.

- Links tab: Have links to predecessors of a micro-task. Here for example on the Electricity task in blue, we see in black the links of the tasks of the same sequence and in orange the links between sequences, with for each the type of link associated.

- Onglets Previous and Successor: Add links to start this micro-task (see below Editing links to the micro-task).
- Notes tab: Add notes on a micro-task, by clicking on the
 at the bottom right of the page.

You will then see a yellow post it on the micro-task, like this: ![]() .
.
5.3. Editing links to the micro-task
5.3.1. From a task
- In the Start Condition tab, when you add a new link, after you choose the task, you can choose the area of the task
- This means choosing the micro-task or a task to link to a task:
-
-
Linking a micro-task
-
Link a task to the current task in the same sequence
-
Link from one task to the current task in another sequence
-


5.3.2. Ecran condition de démarrage micro tâche zone
- From the Micro-Task Start Condition () tab, you can add two types of links:
- Micro Task – Micro Task
- Task – Micro Task
- Then click on to choose a task and then choose the area:

![]() A task link – micro-task will not take into account zoning but the link with the task. For example micro-task PEIN-Painting apartment 16 is related to the T1-task 1 of the link test sequence. The zoning remains the same (APPART 16), now Teamoty is waiting to finish ALL areas of T1-task 1 to start the micro-task PEIN-Peinture:
A task link – micro-task will not take into account zoning but the link with the task. For example micro-task PEIN-Painting apartment 16 is related to the T1-task 1 of the link test sequence. The zoning remains the same (APPART 16), now Teamoty is waiting to finish ALL areas of T1-task 1 to start the micro-task PEIN-Peinture:

5.3.3. Link Visualization
- All the links of a task and micro-task are represented in the “Starting condition” tab even the links between tasks of the same sequence.
- Depending on the type of link created, you will see a different color in the task pop-up as well as in editing the sequences.
You will find the legend of the colors at the bottom left of the pages of edition: 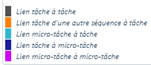
5.4. Filters
From the schedule, you can filter:
- Task Types:
 , by default technical tasks are not displayed,
 - Tags:
 (button appears if tags are added to tasks)
 - Trades :
 ,
, - Companies:
 (button appears if companies are created and associated with tasks),
 - Stakeholders :
 (button appears if speakers are associated with tasks)
 - Task color:
 , either by batch or by company.
 - Display of certain elements:
 such as weekends, days off. You can also add the headcount curve or the headcount table by company and/or batch when printing the schedule, You can also choose to disable key project dates (see Keys date). In this filter you can also display hidden areas (see Areas), progress, red thread etc.
Lorsqu’un filtre est actif, il se matérialise par le même pictogramme en orange : ![]() .
.
![]() To be able to display one of these 3 elements (the number of employees curve; the number of employees by company and by batch), you must filter the schedule over a period of up to 8 months and choose a suitable schedule format (see below Schedule format).
To be able to display one of these 3 elements (the number of employees curve; the number of employees by company and by batch), you must filter the schedule over a period of up to 8 months and choose a suitable schedule format (see below Schedule format).
You can also filter and edit sequences directly from this tab: ![]() , without having to go out of the schedule and go to the Sequences tab:
, without having to go out of the schedule and go to the Sequences tab:
- Creating a sequence from the schedule is possible with this button:

- You also have the shortcut to the “Link between sequences” via this button:

- The
 filter to select one or more sequences:
 Allows each sequence to edit the
  sequence or to go to the Edit Sequence Tasks
  .
.
- You will find the shortcut
 regeneration sequences to force the update if adjustments have been made for example.
5.5. Display
- When a representation of the schedule after filtering suits you, you can save it so that you can find it more easily afterwards. To do this, simply go to Display Preferences and click on the save button:
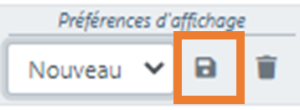
- A window opens to edit the display preference. You can choose to create a display preference for you or for the project
- To find this display, return to this drop-down list where you can delete them directly :
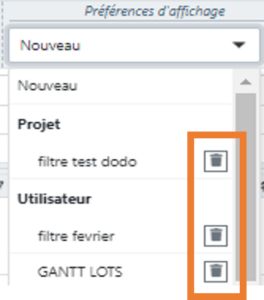
- You can make as many display backup as you want.
![]() This layout is user-specific and therefore will not be accessible to other users.
This layout is user-specific and therefore will not be accessible to other users.
5.6. Schedule format
- By returning to the Edit tab of the schedule, you can choose the format to display the schedule. By default, the schedule is generated in geo-temporal format.
- Each format is a different visualization of the schedule, highlighting different information.
- Each display format can be saved in the display preferences.
![]() In geo-temporal grouped to zones or geo-temporal sequences, two new elements are available: continuity of tasks over the period (days not worked) and progress cursors:
In geo-temporal grouped to zones or geo-temporal sequences, two new elements are available: continuity of tasks over the period (days not worked) and progress cursors:
1 . You can see [ ] brackets that indicate where the dotted spots are. Here we observe that on the sequence dwellings there is a task in week 3 that is not considered completed thanks to the left check mark: [ And in the same way we see that the last task on this sequence is week 13 with the checkmark: ]
If the execution goes as planned, you should have your two hooks close, as for the facade sequence.
2. You can also see if a sequence or task has a continuity of action. For example on the stairwell sequence we see very light green in weeks 5 and 6, which means that there is no task over this period.

- To find the different representations of the schedule, go to the first Format filter, you will find in the list:
-
- Geo-Temporal (Sequence): Displays the schedule by area with sequences (creating large bars of the beginning/end of the sequence) without going into detail of tasks:

-
- Geo-time (trades): Displays the schedule by zone with the batches from the beginning to the end of their intervention without taking into account the interruptions of work:

-
- Geo-temporal (companies): Displays the schedule by zone according to the companies from the beginning until the end of their intervention without taking into account the work interruptions:

-
- Gantt Zones (tasks): Displays the schedule in Gantt format by zones with the details of the tasks with the start and end dates, the duration and the percentage of progress:

-
- Gantt (micro-tasks): Displays the schedule in “conventional” Gantt format with the dates in the execution order, with the start and end dates, the duration and the percentage of progress:

-
- Gantt (tasks): Displays the schedule in Gantt format with all sequences without zoning:

-
- Gantt (trades): Displays the schedule in Gantt format with lots without zoning:

-
- Gantt (companies): Displays the schedule in Gantt format with companies without zoning:

![]()
For each format, it is possible to filter and print the resulting schedule in PDF format (see Printing below for instructions).
5.7. Printing
- Once the filters and format have been chosen, you can export and print to PDF. To do this, simply click on the button Print,
 on the schedule.
 - Clicking on this button opens a page with several data:
- The printing format of the schedule (plotter (=tracer): which blocks the width of the schedule);
- A title for printing if desired
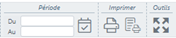
- A period to print if desired
- Teamoty automatically adapts the landscape or portrait format according to the chosen schedule and format.
To refine the printing, you can click on ![]() , in order to display the days off, key dates for example, remove key dates or perform filters.
, in order to display the days off, key dates for example, remove key dates or perform filters.
- You can remove the date of the day highlighted in your prints by unchecking:
- It is possible to graphically delete the progress of tasks by unchecking:
- You can also print your display preferences using this screen.
- You have the possibility to print all sequences, batches or companies at once with this drop-down list:
. Teamoty will execute the action in the background and will be available in Downloads
To validate the print, simply click on the button 

In the Download tab in PROJECT, you will still have access to it with the option to upload it again ![]() or delete it
or delete it ![]() . The elements on this screen are user specific.
. The elements on this screen are user specific.
![]() If nothing is changed in this window, Teamoty will print what is displayed on the screen.
If nothing is changed in this window, Teamoty will print what is displayed on the screen.
- To print the schedule caption, simply click on the button
 and then choose the print format and add a print title. You have the possibility to print the legends in flow or classic:
-
Flow Legend: You will have the workflow in Gantt format with the graphical links between the tasks (as for printing sequences):
-
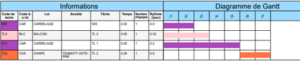
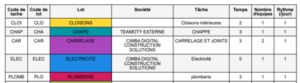
Classic Legend: As was the case with the assignment list in alphabetical order with the rhythm of each assignment:
-
5.8. Stakeholders
From the Planning tab, you have the possibility to assign speakers to each task or micro-task, in order to create a schedule per person. To do so, simply go to the Stakeholders tab, at the top right: ![]()
- First of all to add new people to the project, click on and fill in the elements: First name, LAST NAME and email address. If the person is already informed, then he will appear in the proposals.
From there, you can always edit by clicking on: ![]() or invite it to the project:
or invite it to the project: ![]() .
.
5.8.1. Adding on a micro-task
To add a responder to a micro-task (area task):
- You have to take the latter from the list on the right then drag it on the micro-task concerned, a black dot will be added with the initials of the person:
 .
. - To delete the addition of speakers on a micro-task, select:
 and click on the micro-task to be cleaned.
 - To duplicate workers from one micro-task to another, select:
 and then click on the micro-task with the people you want to duplicate, then click on the desired micro-task.
 - You can also go to the Edit Micro Task by clicking on: .
Then fill in the Stakeholders table with the button: ![]()

If the person is already filled in, then it will appear in the proposals, otherwise click on ![]() to add it.
to add it.
5.8.2. Adding to a Task
To add a responder to a task in a sequence:
- Click on: shortcut of the Edit Tasks button;
- Then in the Stakeholder tab, if the person is already filled in, then he will appear in the proposals, otherwise click on to add him.
- Once a responder is added, all tasks in the sequence will be marked with a transparent dot with the initials of the person:
 .
.
5.8.3. Printing
By default, the planning format remains that of the geo-temporal with “schedule of conditions”:
- You can also display a user Gantt that will give a schedule with one line per speaker:

- As on the PLANNING tab, you can filter by period, print the schedule and legends, and switch to full screen mode:
5.9. Notes
- Added notes on sequences, tasks and micro-tasks are grouped in the Notes tab, available in the left column of the Project tab:

- You will find the notes grouped by sequence and then by task, which you can open/close with the arrow:

- All notes can be edited from the Edit button:

- You can filter this list by creator and period. This list is also printable by clicking on the Print tab

5.10. Versions
- Teamoty allows to manage several versions of planning in order to make scenarios, backup of planning, projected versions. At the start of the project, you have a so-called «basic» version, corresponding to your objective, theoretical planning. Once created, you can duplicate it to make it live by pointing to the progress by defining it as “in progress”. You can have as many versions as necessary.
- To access the version management screen, go to the Versions tab in the Project tab, and you will find the list of available versions on your project, as below for example:

In order to generate relationships and advances between reality and theory, we will find at least two types of versions:
- The basic version or objective schedule: it is the schedule determined at the beginning of the project that will not evolve and that will not be pointed out. This version is materialized by this button:

- The current version or execution schedule: it is the schedule that is subject to change and that bears the score. It is this version that opens with the opening of the project on Teamoty. This version is materialized by this button:

- Thanks to these two versions, we can have a comparison between the theory (with the basic version) and the reality (with the current version),
- The button Edit , allows you to modify the information entered for the version,
- The button Delete,
 allows you to delete the version,
 - The button Duplicate,
 allows you to duplicate a version.
- It is possible to score on several versions simultaneously. Simply check the box
 when creating or editing a version.
Pay attention: The score will be transverse if and only if the micro-task is present on the selected versions.
- When duplicating a version, the action will be done in the background while you can continue working on your project, the following message will appear:

At the top right of the page, you will find this button, indicating the pending tasks: ![]() , by clicking on it you will find:
, by clicking on it you will find:

- The system will copy all elements of the version. We can then make changes to this new version and view different versions of the schedule.
At the time of duplication, you can duplicate with projection by choosing the date of the registration of the schedule as well as the part of zoning to be projected:
By default, at any time, you can navigate between different versions using the drop-down list in the top right: By default, the version checked “in progress” always opens. You can also access the Version Management screen by clicking on the shortcut at the top right: ![]() .
.


5.10.1. Final Removal of Version
- Once you delete a version, it remains archived but not permanently deleted. You can restore it at any time. Now you can delete it permanently from the project.
- To do this, for versions already deleted. You can find them by going to Versions, then Status: Deleted
- Then come to Edit the version to delete, then click on
 at the bottom right of the screen:

5.11. Task Pointing
Once you have generated your version of the execution schedule, you can start pointing the project. In Teamoty, there are several ways to track the progress of tasks performed.
- First, from the Planning screen, you can select Pointer mode:

Here you will find two possible scoring modes:
- 100% Pointing:
 is used to point to completed tasks. Simply click on the completed tasks. The task then becomes lighter (or darker depending on the initial color) and crossed out:
- Partial Pointing:
 is used to partially point to tasks started but not yet completed. To do this, simply choose this mode, and go directly to the task to be pointed and this screen will appear:
 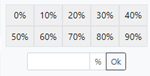 either you click on the percentage of progress or you fill in the box the percentage of progress. On the schedule, the task will become lighter (or darker depending on the color of the task):
- Le pointage auto : Quand vous sélectionné le bouton du pointage partiel, vous verrez un bouton “auto” :
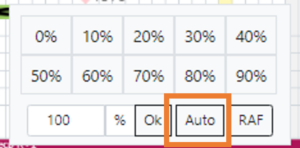 . You do not need to enter a progress value, Teamoty will automatically put the score of the task against the current date
Examples: If the task is in the past, Teamoty will point to it completed, or if the task started yesterday and finished tomorrow, it will point to 50%
- You have the possibility to point a milestone (if it has been defined as a point) in the same way, however only the 100% is possible for a milestone.
![]() Shortcut: By selecting one of the two Pointer modes, you can switch between them by holding down the CTRL key.
Shortcut: By selecting one of the two Pointer modes, you can switch between them by holding down the CTRL key.
You can also score tasks using the Workflow display (see Workflow below) and also with the mobile version (see Mobile version).
- The group pointing:
 is used to mass-point tasks. You arrive on a screen where you find in the header of the filters to be done. You must at least fill in a period, then click on
  .
.
You can either change the status of each micro-task, or you can select the tasks to be mass-pointed with: ![]()
- Pre-pointing validation:
 is used to mass validate the pre-scoring done by the users. You arrive on a screen with all the pre-score waiting for validation that you can filter. Simply click on
  .
.
5.12. Workflow
On Teamoty, you can generate another visualization of the schedule, which more generally corresponds to the productivity matrix. The workflow is another display of the schedule in table format.
- To access this schedule, simply click in Workflow on the left in the Project tab.
- The table is inverted in relation to the geo-temporal schedule, since the sequences/tasks are in the table header, and the task date is the data of the table, with by default their start date. As on the schedule, filter the areas on the left: using the funnel.

- The filters are the same as those in the Planning tab, namely, the choice of sequences, batches, companies and over a given period, as well as printing. You can also filter on task type, as well as task statuses.
- Display preferences can be added.
- You can export the workflow to Excel by clicking on:
 .
.
- Tasks are represented by their chronological execution date according to the sequence and the execution area :
- Tasks in red: not pointed and in the past (late)
- Pink tasks: partially and in the past (late)
- Tasks in orange: not pointed and in progress
- Tasks in light green: partially pointed and in progress
- Dark green tasks: 100% pointed
- Blank tasks: not pointed and in the future
Dates in the past or the current date are easily traceable.
On this representation of the schedule, it is also possible to point out the tasks:
- To do this, just go to the Pointer mode, there is the same display as the schedule:
- 100% Pointing: is used to point to completed tasks. Simply click on the completed tasks. The task then turns green.
- Partial Pointing: is used to partially point to tasks that have started. To do this, simply choose the percentage of progress either with the cursor or by entering in the box the percentage of progress, then click on the tasks. The task will remain red or orange. It will turn green once the score is 100%.
- Auto Pointing: When you select the partial pointing button, you will see an “auto” button: . You do not need to enter a progress value, Teamoty will automatically put the score of the task against the current date
Examples: If the task is in the past, Teamoty will point to it completed, or if the task started yesterday and finished tomorrow, it will point to 50%
- You have the possibility to point a milestone (if it has been defined as a point) in the same way, however only the 100% is possible for a milestone.
![]() Shortcut: By selecting one of the two Pointer mode, you can switch between them by holding down the CTRL key.
Shortcut: By selecting one of the two Pointer mode, you can switch between them by holding down the CTRL key.
- The group pointing: is used to mass-point tasks. You arrive on a screen where you find in the header of the filters to be done. You must at least fill in a period, then click on .
You can either change the status of each micro-task, or you can select the tasks to be mass-pointed with: ![]()
- Pre-pointing validation: is used to mass validate the pre-scoring done by the users. You arrive on a screen with all the pre-score waiting for validation that you can filter. Simply click on .
5.13. Rest to be done (RTBD)
You can generate rest to be done (RTBD), during your score (planning, workflow or mobile). These are the partially pointed tasks where an action rest to be done to complete it 100%. Any rest to be done does not prevent successors from completing the task.
To create a rest to be done, you can do it on the web or on mobile.
- From the web, either on the Planning or Workflow tab, with the “Point to progress” button:
You will find a RTBD button: 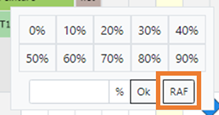
From there, you will have to edit this RTBD : description, cause, progress, start date, duration, effective. You can also add comments and photos, then click ![]()

- From the mobile version, you will find the button:
 , and the same window will open to edit this rest to do.
- This will generate a new task in the schedule on the target completion date. This new task is then pointable as a classic task.
- These rest to be done are easily spotted on the schedule by a blue dot:
 , not related to the original task.
 - You can filter this type of task from the schedule to highlight them.
5.13.1. Follow-up
- You can generate a tracking of the rest to be done from the web version.
- To access this follow-up, go to the Rest To Be Done tab to the right of the Project tab, where you will find the follow-up of the leftovers to be done of the version.
- You can filter by batch, by company, by period, by status, or by creator and then click on the button to generate the desired RTBD list.
- For each RAF, you have the possibility to edit it in order to modify the information, namely the cause, the start date, the duration, the staff and the date of creation of the RAF under the cause.
- You can also delete the RTBD by clicking on .
- In the Print tab, you can print the list generated previously, and set the level of printing, so either at the level of the current area (for example the dwelling), or at the level of the floor, then click on
- Alternatively, you can export the resulting list by going to the Export tab and then
 , which will generate an Excel file.
5.13.2. Reports
- Several RTBD reports are available to analyze the nature or cause of delays:
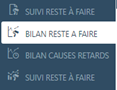
- The two tabs Balance sheet remains to be done and balance sheet causes delays. For both, which you can filter by batch or company via the following filter:
 .
.
- The first review highlights the causes of the RTBD generated on the project:
- The second assessment allows to know the cause of delays in the execution of the RTBD.

- The last tab, always in the Rest to be done tab, then in Tracking Rest to be done, allows you to obtain graphically all the information of these RAF such as the number, by batch, by company and the status by date, example below:

- As with other balance sheets and monitoring, you can filter by batch or company via the following filter:
5.14. Blocking points
- A blocking point is an element that prevents the proper execution of tasks and therefore the continuity of events, which can generate delays on the schedule. This is therefore a point to be settled before it impacts the schedule as the absence of the equipment or a lack of plan.
- The blocking points in the schedule are represented by a red dot on the micro-task as below:
 . Unlike rest to be done, a blocking point does not generate the creation of a new task.
To create a blocking point, you can either generate them from the web or the mobile version.
- From the web, simply go to Planning, or in the Workflow, then click on the Blocking points tab on the first button
 , then click on the micro-task, you will fall on the page below.
You will then need to click ![]()

- A page will open with the block point information to be filled in, then click


- The second button
 is a shortcut to the Tracker tab.
![]() You can add multiple blocking points on each micro-task. To see the details of the blocking points of a micro-task, click on Edit micro-tasks
You can add multiple blocking points on each micro-task. To see the details of the blocking points of a micro-task, click on Edit micro-tasks ![]() and then on the Blocking points tab.
and then on the Blocking points tab.
- From the mobile version, you can click on a task to see its details. Here you will find the “Add Blocking Point” button:
- As on the web version, it will be necessary to edit the blocking point with the name, date of resolution, and possibility to add comments and photos.
5.14. Follow-up
- The list of blocking points can be found in the PROJECT tab on the left in Blocking points, where, as for the leftovers to be done, it is possible to have their follow-ups with the possibility of filtering by batch, by company, by period, by status or by creator and then clicking on To generate the desired list.
- You will see for each block the date the block was created in parenthesis below the target date.
- In the Print
 , Image tab, you can print the previously generated list, you can print the comments and photos by checking “print additional information” and then clicking on
 - Alternatively, you can export the resulting list by going to the Export tab and then , which will generate an Excel file with the same elements.
5.15. Phasing book
It is now possible to have a phasing book by advancement or by occupation by lot or company. This feature provides a new planning format that incorporates the concept of plans. This new module was added in the PROJECT tab then: ![]() .
.
- Here you have two types of format:
- By default, the Progress format is chosen, on which the system will color the zones according to their percentage of progress,
- The format Occupation, allows to represent the occupation of the lots or companies by zones by color defined on the lots or companies
- You will find filters by sequence, batch, company. You also have to create display preferences:

- To choose the level of the area to be seen as well as the associated plan type.
- You will find at the bottom of the page the time frieze to move:

In Occupation format, you will find at the bottom a field Mesh:  , to modify the time mesh.
By placing your mouse over an area (an apartment for example), you will see the progress or occupancy detail.
Both formats are printable in PDF by clicking on ![]() , and select the desired options. Printing is done in the background and will be available in the Download tab.
, and select the desired options. Printing is done in the background and will be available in the Download tab.
You can choose the start day of the phasing book as well as the batch or company occupation. To change these choices, simply go to Settings, Parameters and Phasing Book.
5.16. Project report
You can print project reports by choosing the items to print over a specific period: ![]() . By default, the report will be on today’s date, but you can change it and choose the items to print by checking the boxes. Follow-up can be done by trade or company, then click on:
. By default, the report will be on today’s date, but you can change it and choose the items to print by checking the boxes. Follow-up can be done by trade or company, then click on:
By default, Teamoty will display a period of one week before and after the chosen date. You can change these choices by going to Settings and then Parameters
5.17. Changes Tracability
- For each task, you can generate the history of all changes made, including the date, version, type of change and by whom.
- To do this, click on the Traceability module in the main Project tab. You come across this page:

- You can search for changes made over a given period of time and then click the button.
- You can also export full traceability. Go to the Export tab :
 to generate an Excel file with the details of the changes.